Explore Page
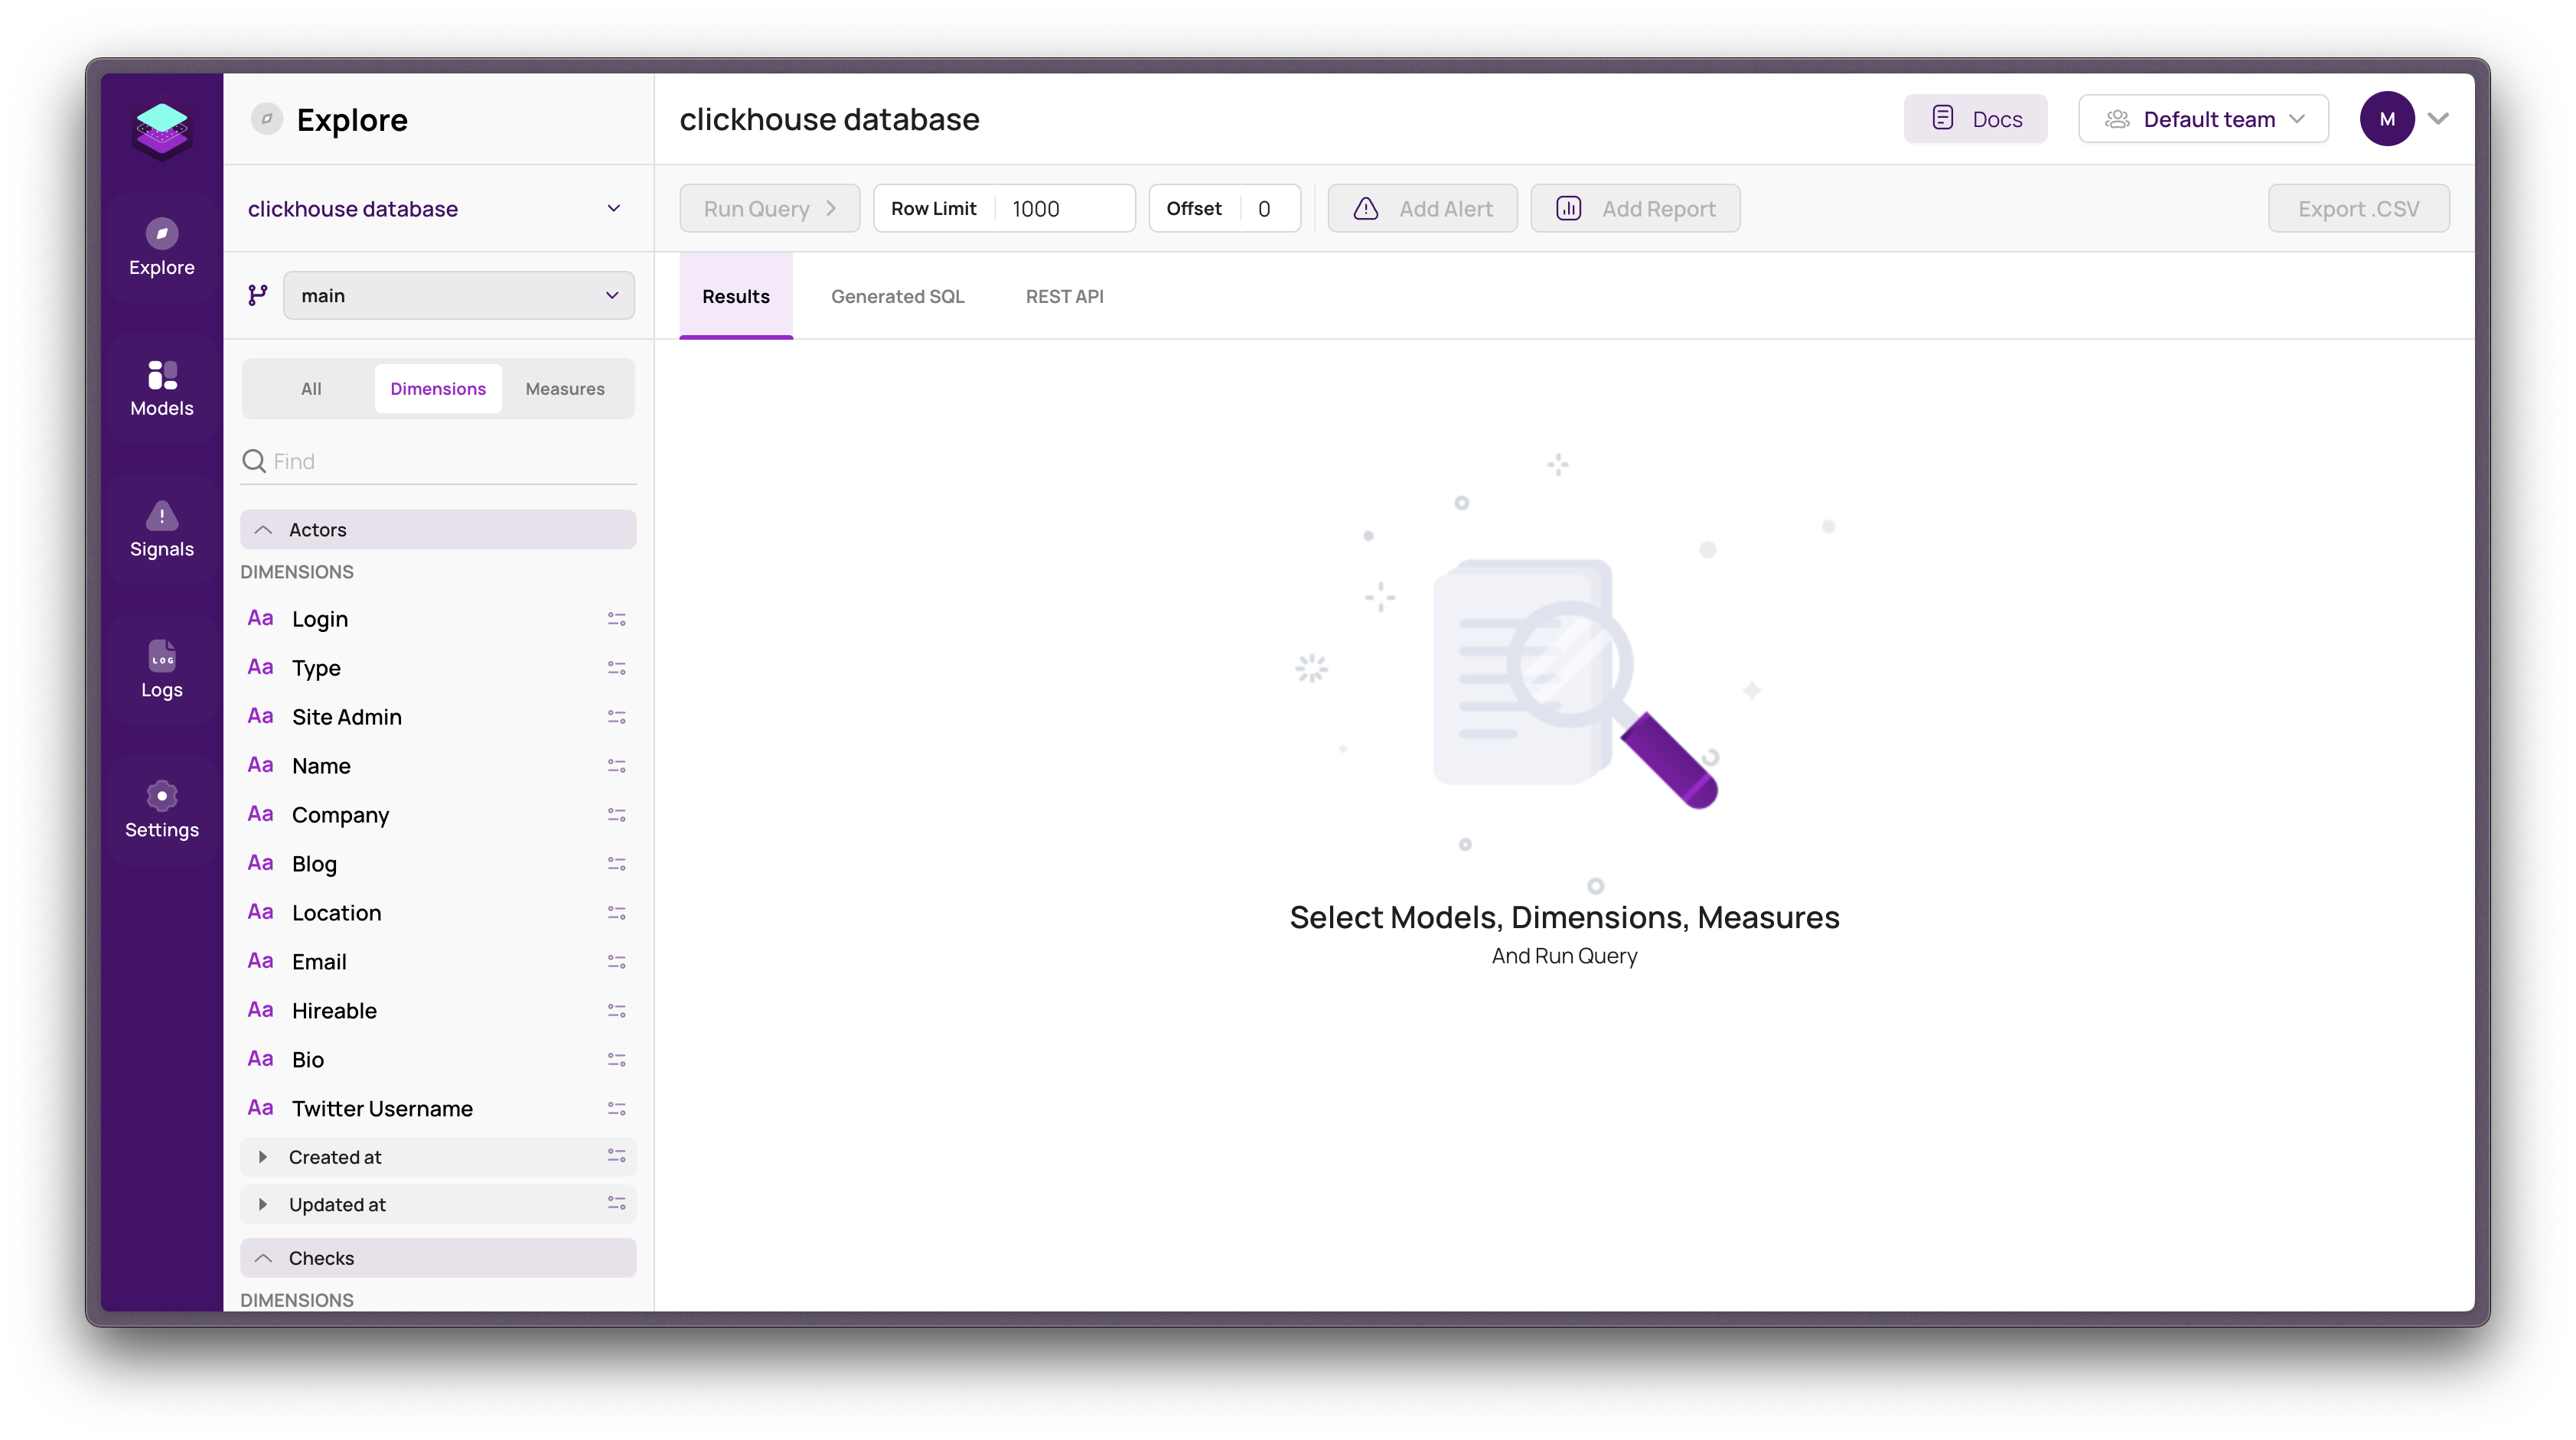
Overview
The Explore page serves as a dynamic and intuitive platform for users to engage with data, offering tools and options for efficient data exploration and analysis. This includes changing data sources, selecting branches, and manipulating data dimensions, measures, and filters. Additional functionalities allow users to run queries, set up alerts or reports, and export data.
Sidebar Actions
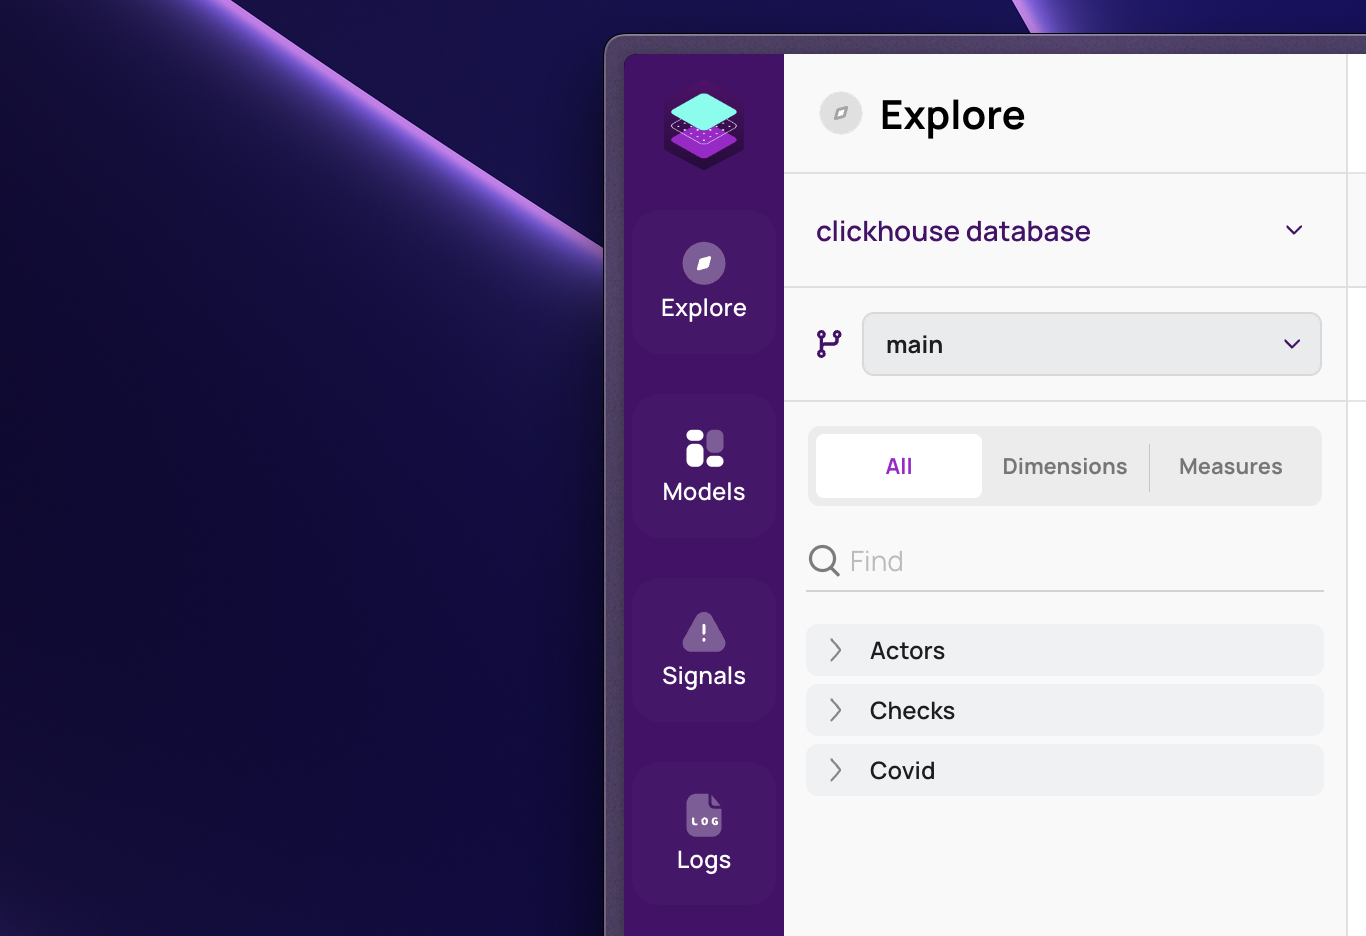
The sidebar in your data tool is where you can do a lot of important stuff. Let's go over how to change your data source, switch branches, and pick the right dimensions and measures.
Changing Data Source in Explorer
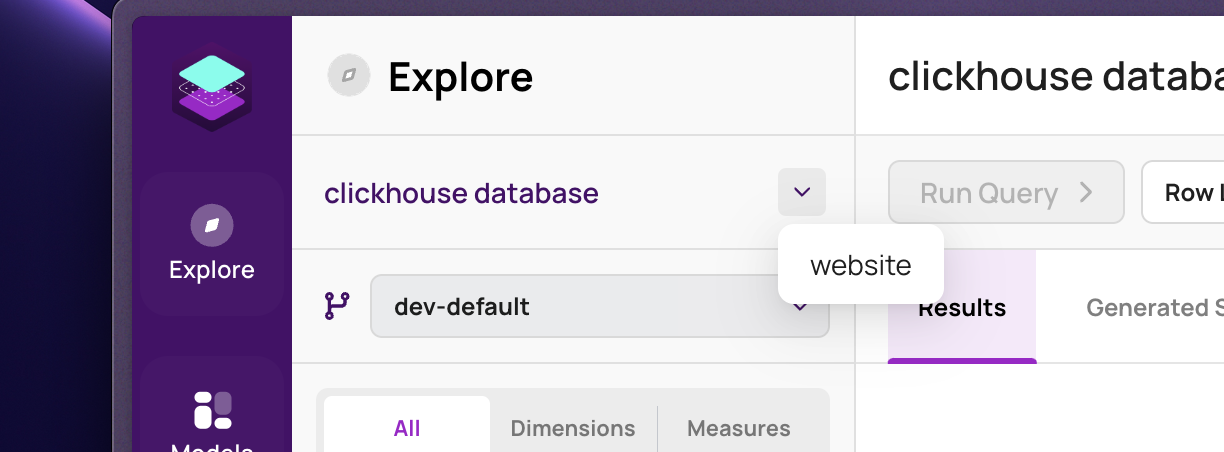 To switch to a different data source:
Find the Data Source in the sidebar.
Pick a New Data Source: Click on the list there and choose the one you want.
It's Changed!: Your data source will change right away.
Switching Branches in Explorer
 To change the branch you're working on:
Look for Branch Section in the sidebar.
Choose Your Branch: Click on the list and pick the branch you need.
Branch Changed: Now you're working in the new branch.
Selecting Dimensions and Measures
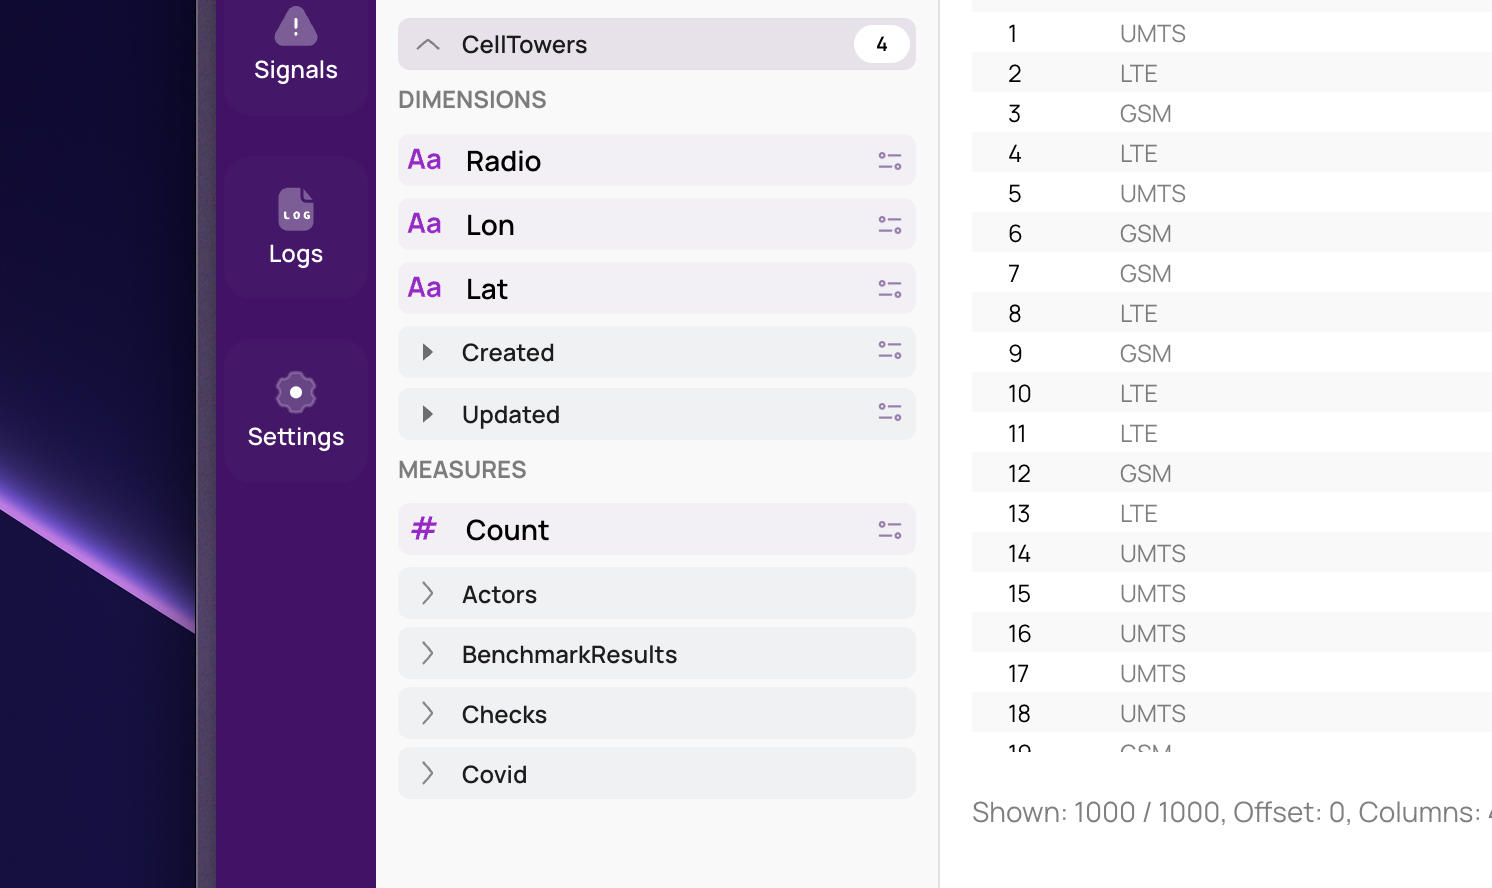
Picking the right dimensions and measures is super important for looking at your data the right way. Here's what to do:
Go to the Sidebar: First, find the sidebar.
Click on Desired Model: Click it and you'll see a list.
See All the Options: This list shows all the measures, dimensions, time dimensions and segments you can use.
Pick What You Need: Choose the ones that you're willing to analyze.
Run Your Query: After picking, run your query to see your data.
- Quick Find: Use the search box to find dimensions or measures fast.
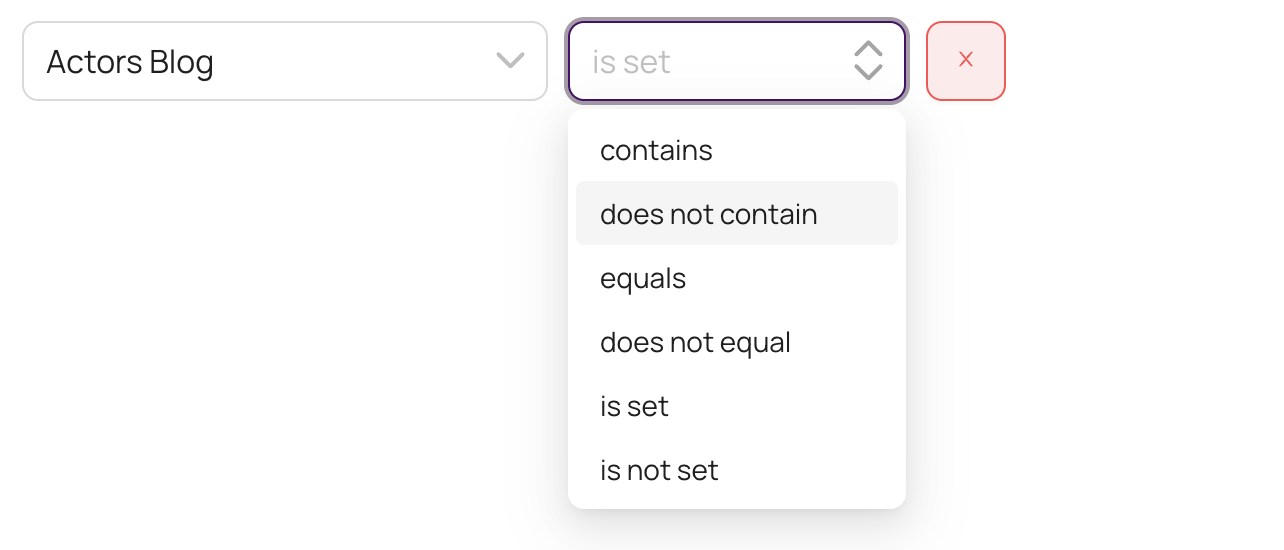
Adding Filters
 Incorporating filters into your analysis is a crucial step for refining and focusing your data exploration. Here’s a professional approach to adding filters through the Explorer Sidebar:
Navigate to Explorer Sidebar: Begin by accessing the sidebar options within the Explorer.
Hover Over Measures or Dimensions: Move your cursor over either the Measures or Dimensions sections in the sidebar.
Initiate Filter Selection: Look for a filter icon on the specific measure or dimension you are interested in. Click on this icon to start setting up a filter.
Configure Filter in Result Tab: After clicking the filter button, switch to the "Result" tab. Here, you'll find options to customize your filter according to your specific data requirements.
Explore Toolbar Functionality Overview

The toolbar in your data analysis tool is equipped with a variety of features to enhance your data exploration and reporting capabilities. Here's a breakdown of the key actions available:
Run Query
- Function: Runs the analysis based on the selected dimensions, measures, and filters.
- Purpose: To dynamically generate and view data results tailored to your current selections.
Set Up Alerts
- Function: Allows for the creation of alerts based on specific data conditions.
- Usage: Configure alert parameters to monitor data changes and receive notifications.
Generate Reports
- Function: Creates reports reflecting your current data view.
- Customization: Offers options to define report parameters and settings for targeted reporting.
Export to CSV
- Function: Enables the export of data into a CSV file.
- Application: Useful for offline data analysis or for sharing data externally.
Work with data
Results Tab
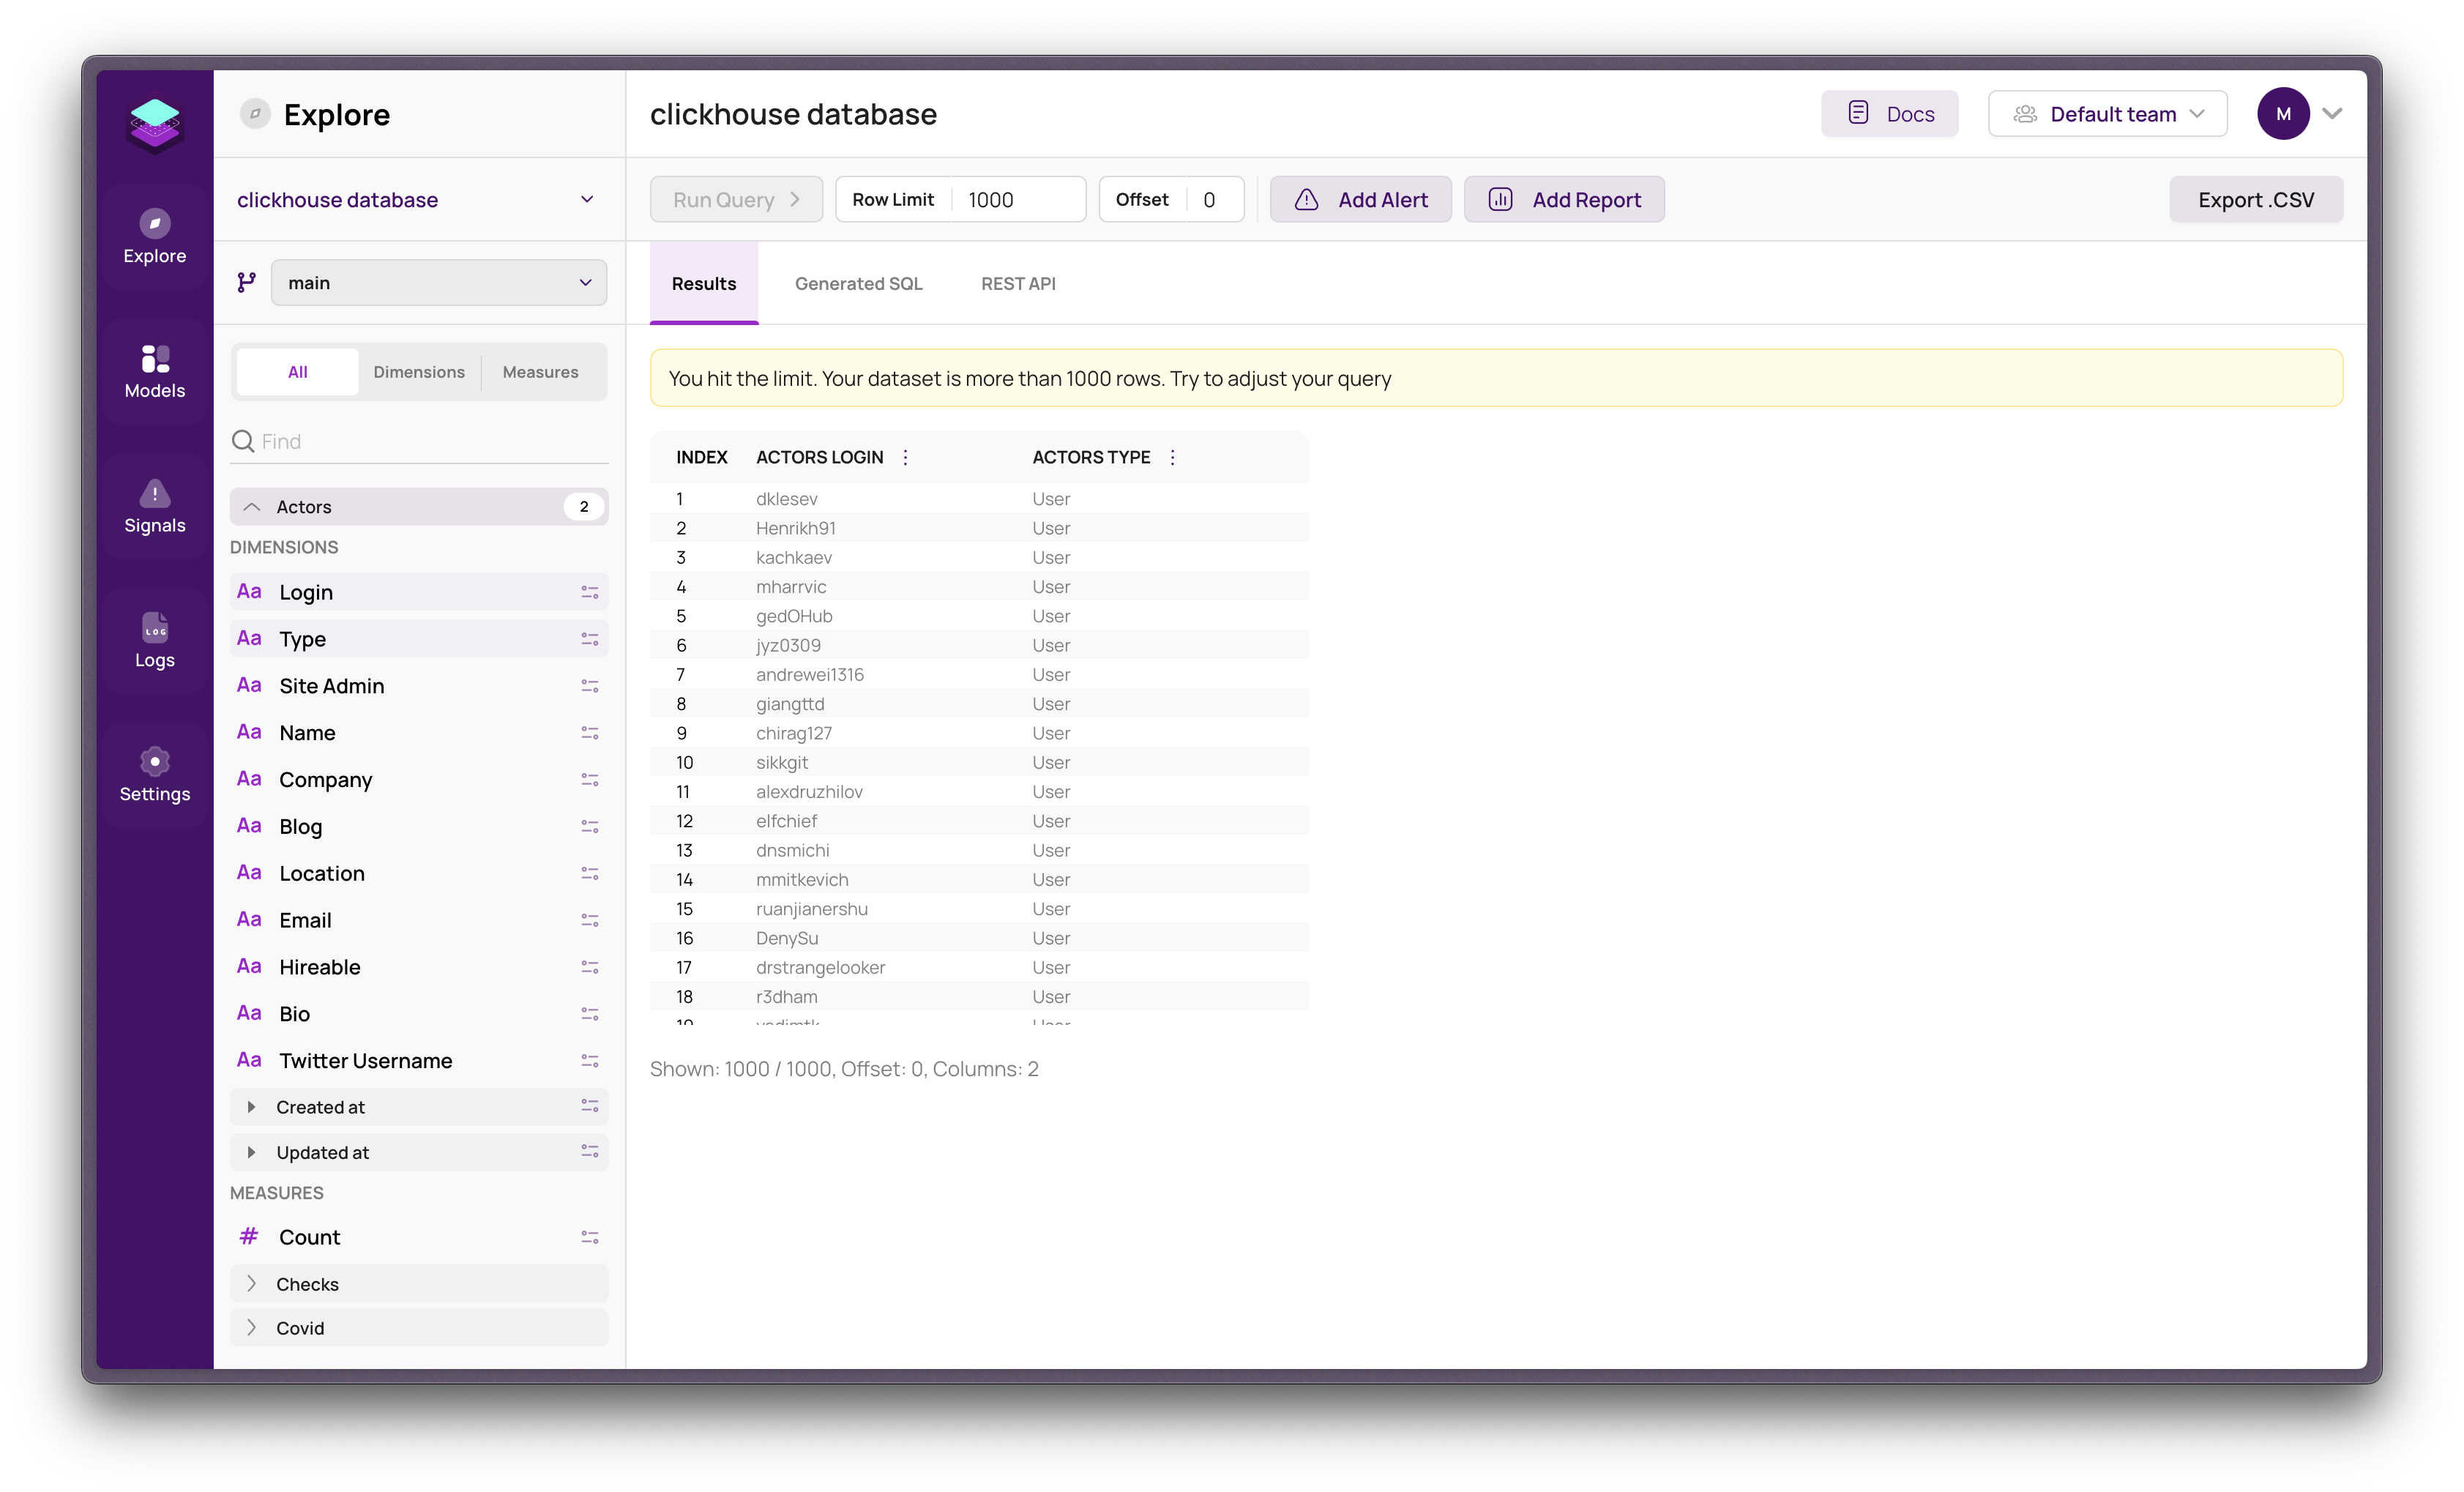
- Display: Shows the outcome of your executed queries.
- Adjustments: Allows configuration of row limits, offsets, and view of applied filters.
Generated SQL Tab
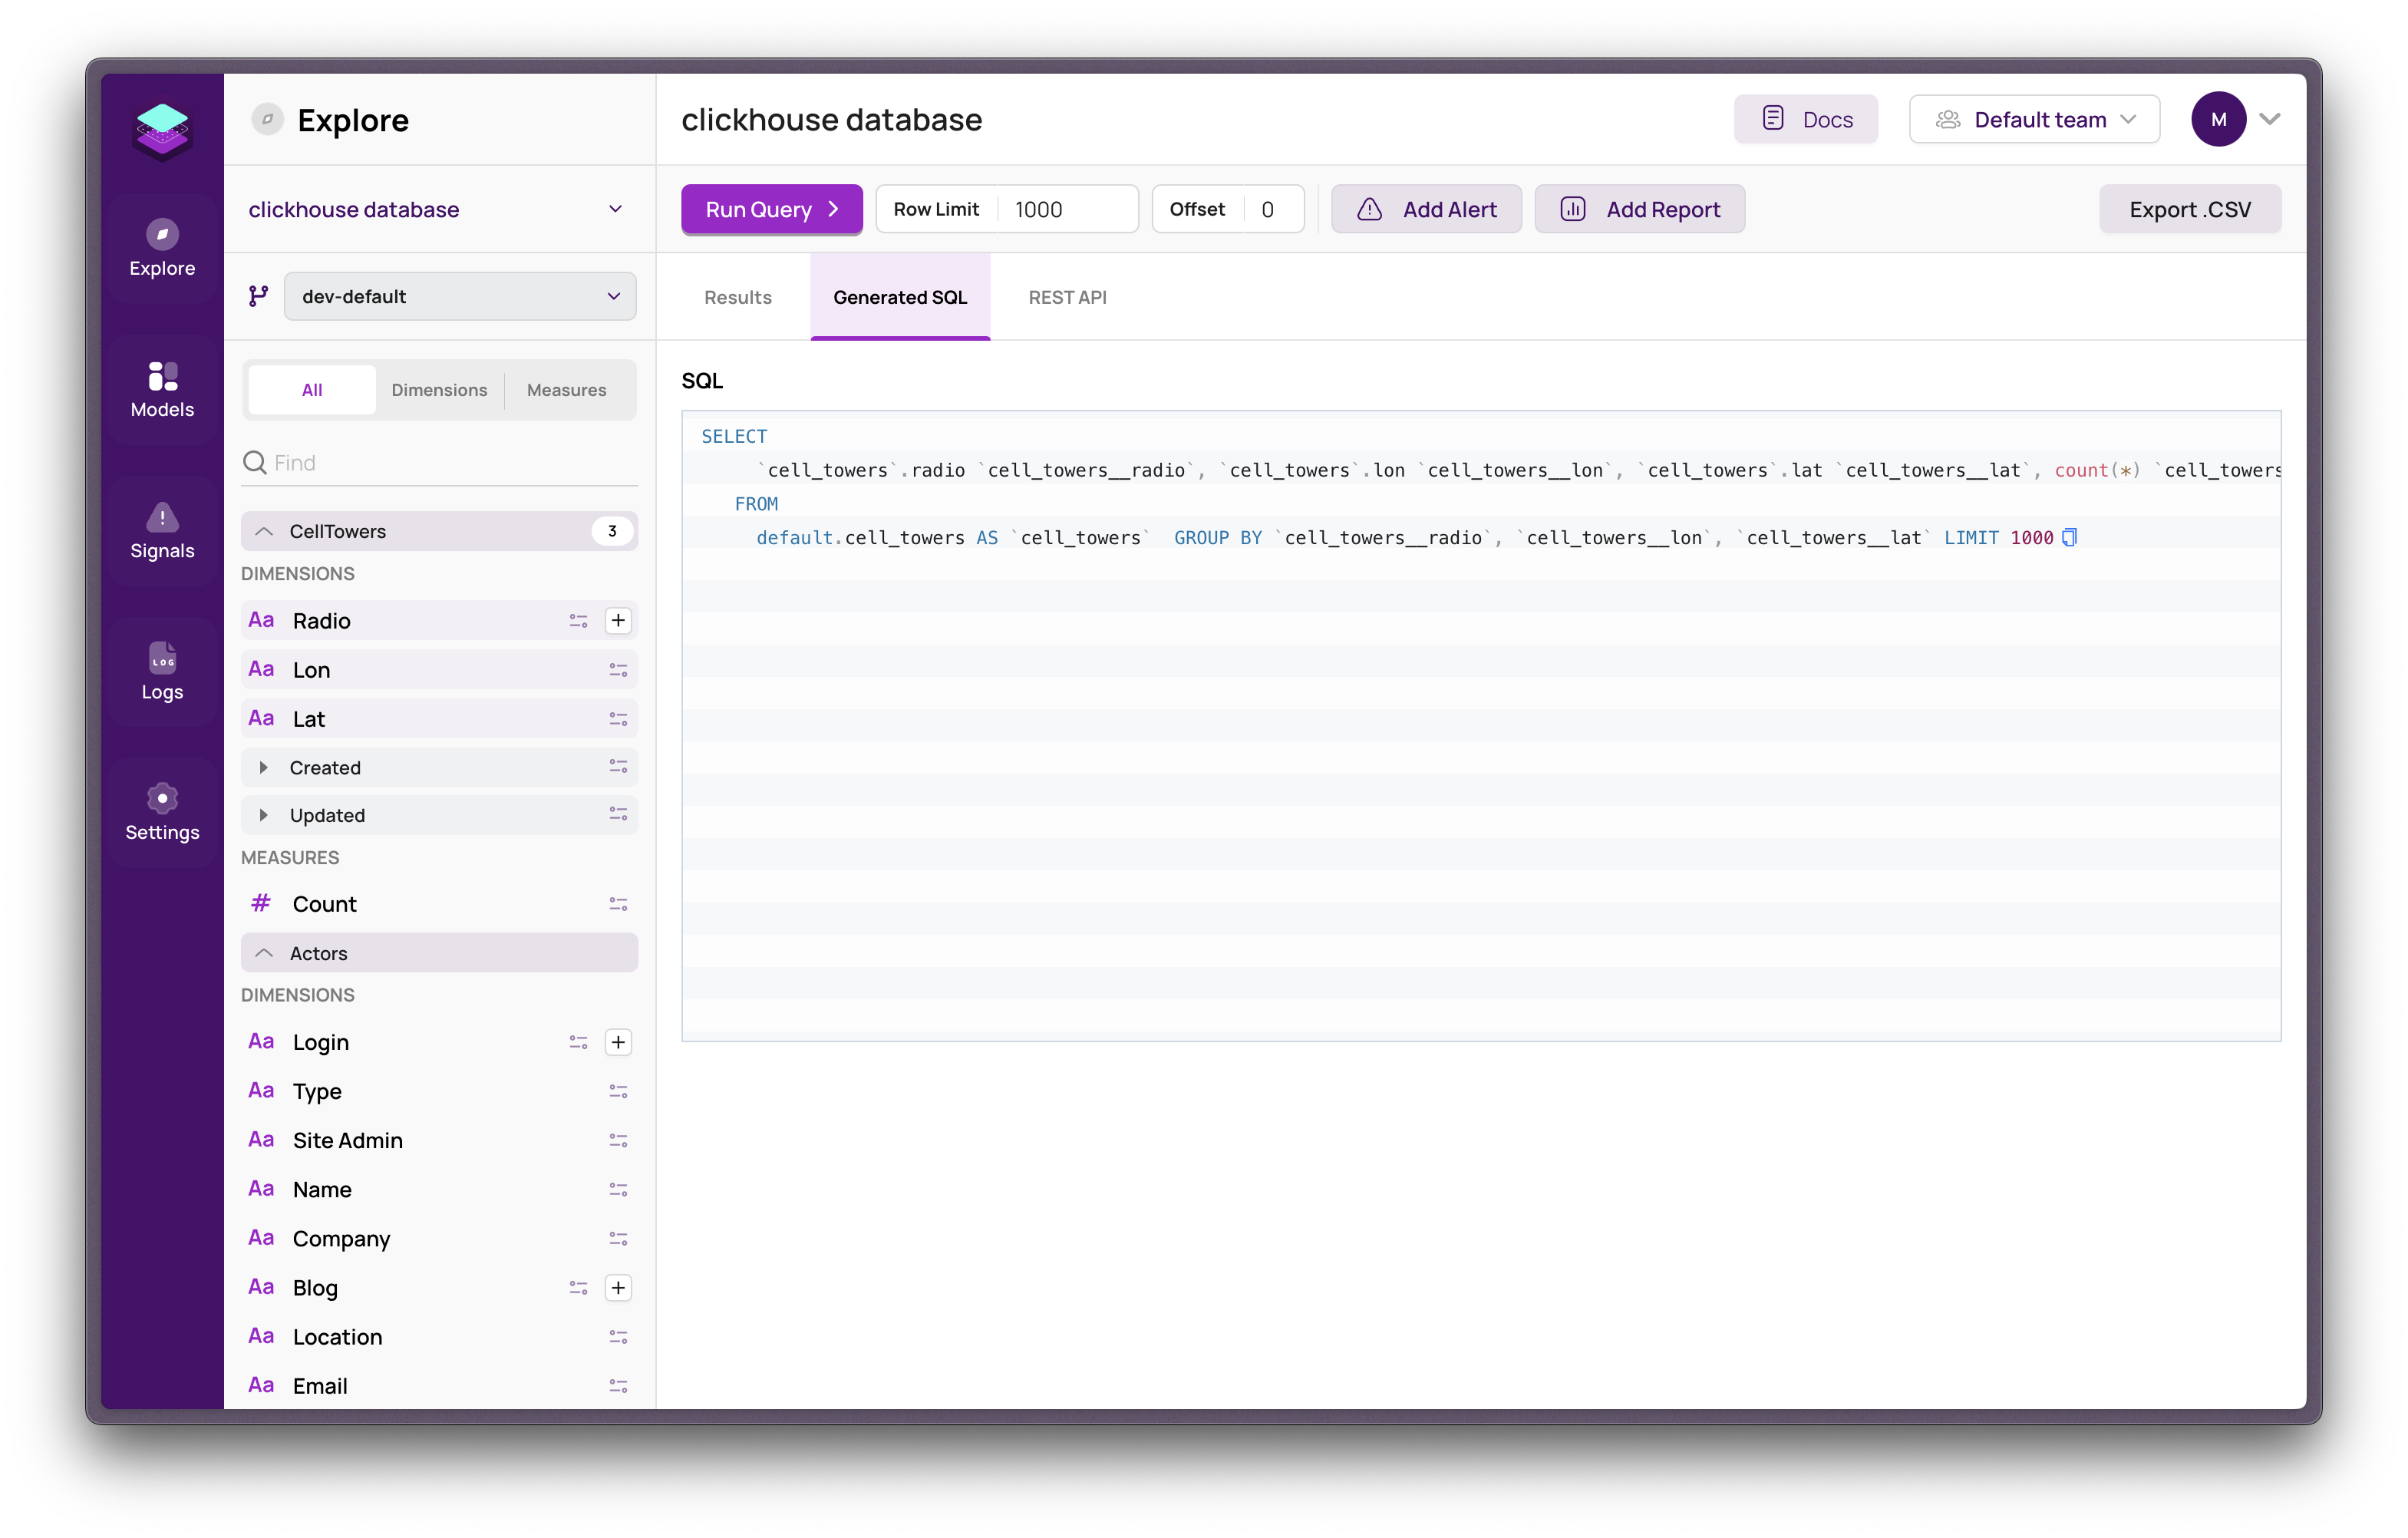
- Function: Displays the automatically generated SQL query post-execution.
- Utility: Useful for understanding the query structure or for manual SQL query replication.
REST API Tab
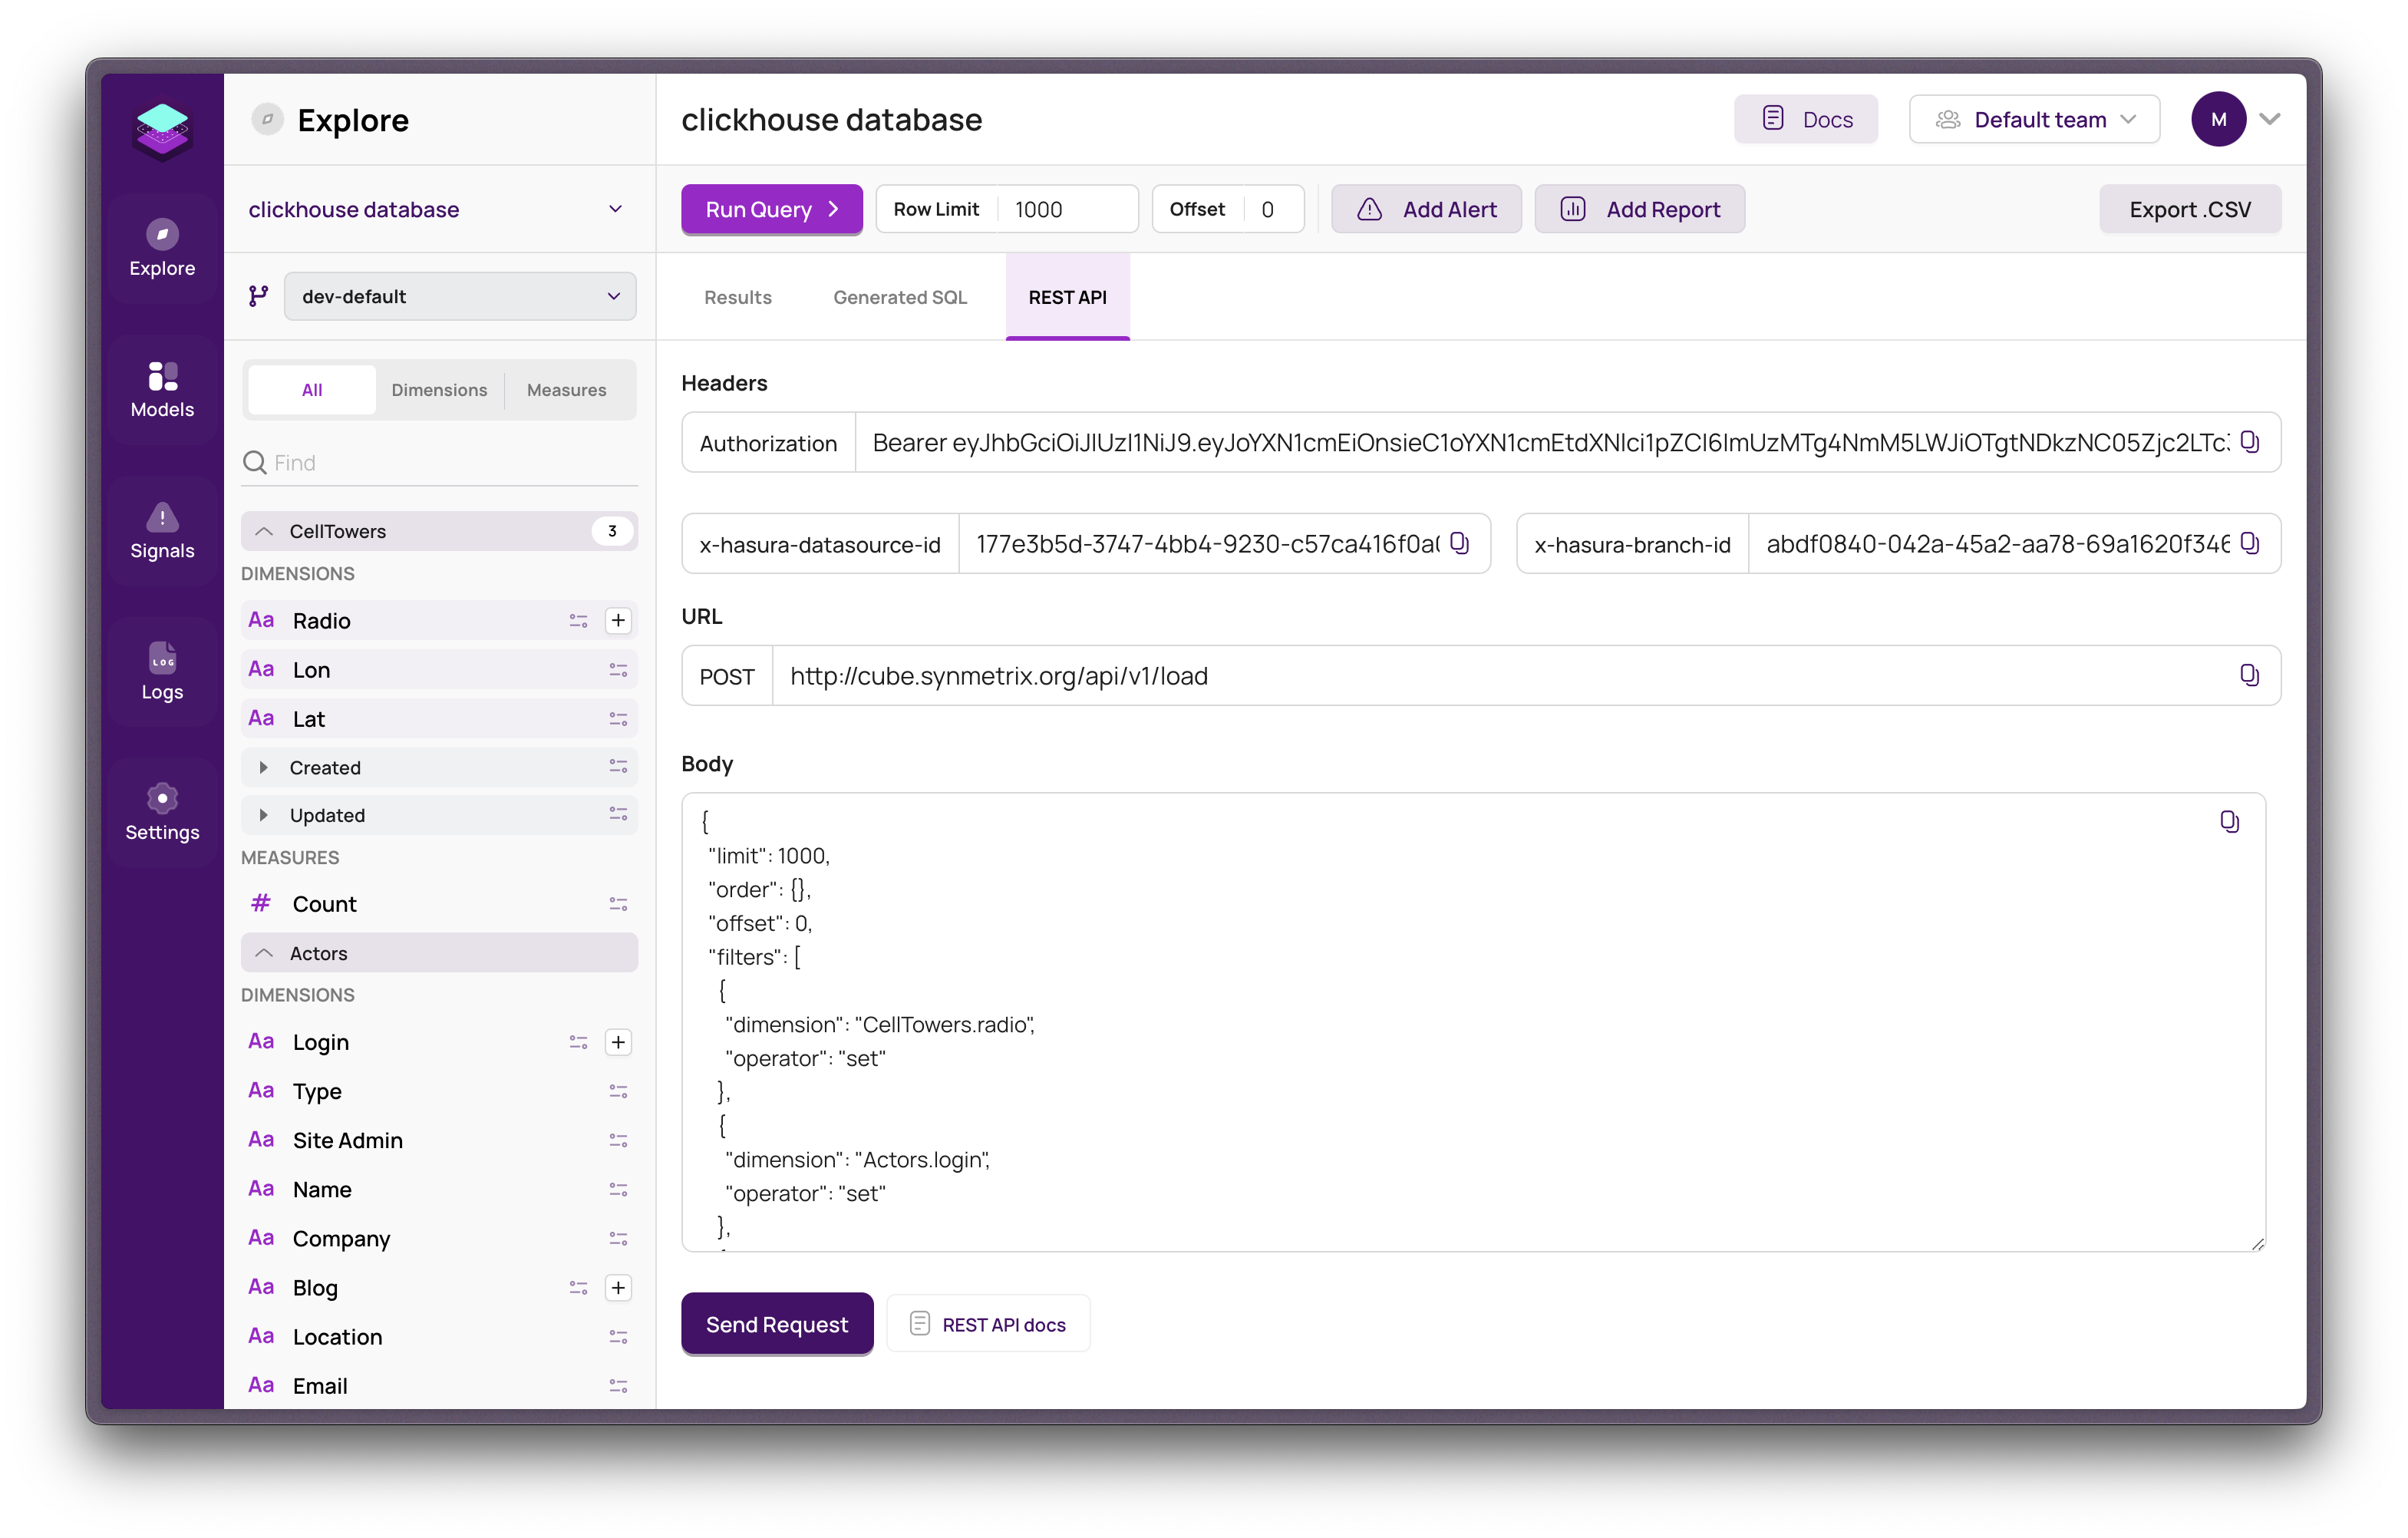
- Access Details: Provides necessary API information for data retrieval.
- Components: Includes headers and the API endpoint URL.
Example API Utilization
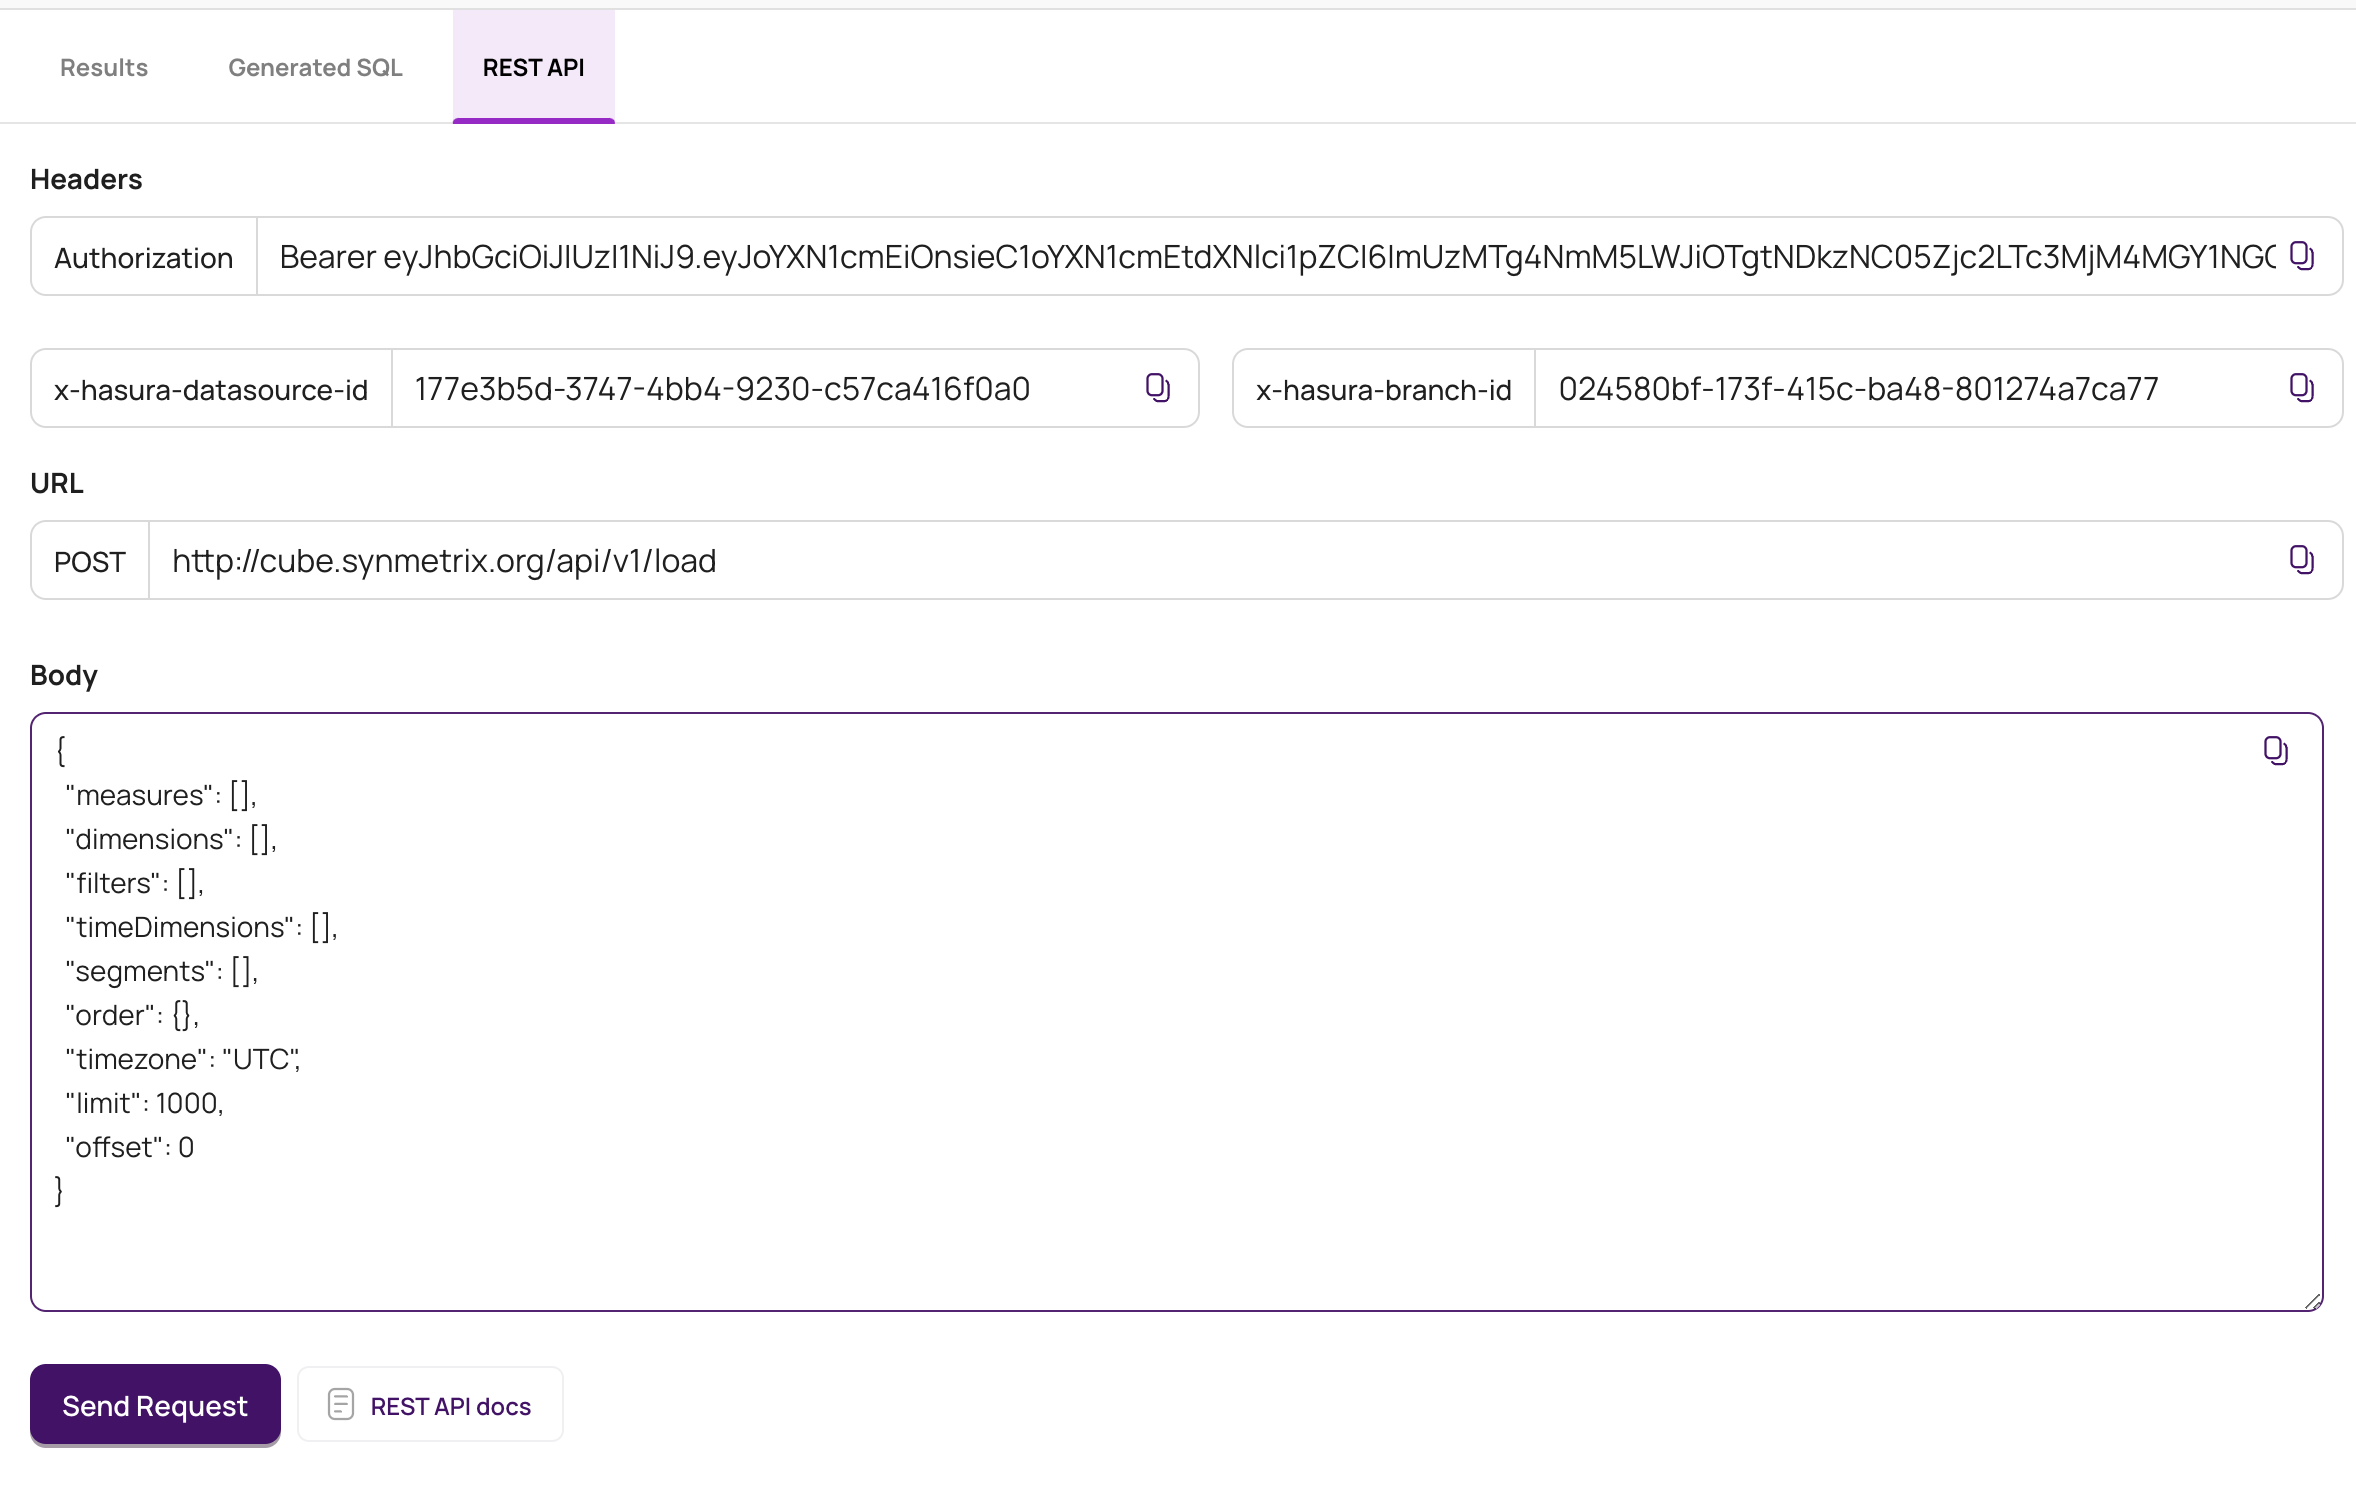
- Headers:
Authorization: Bearer <token>x-hasura-datasource-id: <datasource-id>x-hasura-branch-id: <branch-id>
- URL:
https://cube.synmetrix.org/api/v1/load - Body: Follow the API documentation for accurate setup.
Execute API Request: Enables sending an API request directly from the interface.
📄️ Alerts
The Alerts page is a powerful feature that enables you to configure notifications based on specific conditions within your data. When these conditions are met, an alert is triggered, keeping you informed in real-time through your chosen notification method. Here's how to set up an alert from the Explore page:
📄️ Reports
The Reports page allows you to generate and send a screenshot of the Explore page with predefined parameters, enabling you to monitor metrics at your desired frequency. To create a report, follow these steps from the Explore page: